The Post-Growth Challenge—Secular Stagnation, Inequality and the Limits to Growth
Tim Jackson
CUSP Working Paper Series | No 12

Summary
Critics have long questioned the feasibility (and desirability) of exponential growth on a finite planet. More recently, mainstream economists have begun to suggest some ‘secular’ limits to growth. Sluggish recovery in the wake of the financial crisis has revived discussion of a ‘secular stagnation’ in advanced economies, in particular.
Declining growth rates have in their turn been identified as instrumental in increased inequality and the rise of political populism.
This paper explores these emerging arguments paying a particular attention to the dynamics of secular stagnation. It explores the underlying phenomenon of declining labour productivity growth and unpacks the close relationships between productivity growth, the wage rate and social inequality. It also points to the historical congruence (and potential causal links) between declining productivity growth and resource bottlenecks.
Contrary to some mainstream views, this paper finds no inevitability in the rising inequality that has haunted advanced economies in recent decades, suggesting instead that it lies in the pursuit of growth at all costs, even in the face of challenging fundamentals. This strategy has hindered technological innovation, reinforced inequality and exacerbated financial instability.
At the very least, this paper argues, it is now time for policy to consider seriously the possibility that low growth rates might be ‘the new normal’ and to address carefully the ‘post-growth challenge’ this poses.
1 Introduction
The pursuit of economic growth has been a defining feature of the global economy for well over half a century.1 Growth narratives are evident in every sphere: economic, secular, social and political. Indeed, their prevalence and centrality in political discourse is so pronounced that it is credible to speak of something like a ‘growth fetish’2 – a predominant, often unquestioned assumption that economic expansion is an irreducible good without which social progress is impossible.
Critics of this view also have a long pedigree. Robert Kennedy’s speech at the University of Kansas in March 1968, fifty years ago this year, remains both resonant and prescient of the ensuing critique. The publication of the Club of Rome’s Limits to Growth report four years later established the resource and environmental parameters of the growth critique. Their analysis too has stood the test of time.3
Political responses to the Club of Rome were striking. Politicians of almost every hue stood up to repudiate the report. US President Ronald Reagan saw fit to insist on several occasions that there are ‘no limits to economic growth, because there are no limits to human ingenuity’,4 an argument which owes more to rhetoric than to logic. But the economist Kenneth Boulding, giving evidence to a US House of Representatives Select Committee hearing in 1973 responded differently. ‘Anyone who believes that exponential growth can continue indefinitely on a finite planet,’ he remarked, ‘is either a madman or an economist’.5
The final decades of the twentieth century saw the central issue largely relegated to questions about the speed and efficiency with which it would be possible to ‘decouple’ economic growth from its material impacts and thereby avoid the need to transform the economic system itself. Ecological modernisation (later eco-modernism) prevailed as the politically acceptable face of ecological concern6 and the deeper critique was kept alive largely through marginal voices such as those of economists such as Herman Daly, Marilyn Waring and Richard Douthwaite, supported at times by a parallel argument about the social limits to growth.7
In the decade that has passed since the financial crisis of 2008 however, there has been a resurgence of interest in the growth critique from a variety of different perspectives.8 A deeper recognition of the environmental and social limits to growth has certainly played some part in this more recent debate. But a fascinating new dimension has arisen. As economic uncertainty continues to haunt the most developed countries, some mainstream economists were prepared to flirt with the idea that lower growth rates were not simply a temporary or cyclical phenomenon in the wake of the crisis.
The term ‘secular stagnation’ – first coined in the 1930s – was revived to describe a decline in the rate of economic growth in advanced nations that appears to be only partly to do with the financial conditions of 2008 and to have its roots in factors that predate the crisis by several decades at least. As the futurist Martin Ford has suggested, there are ‘good reasons to believe that the economic goldilocks period has come to an end for many developed nations.’ Low and perhaps declining growth rates may be here to stay.
One of the aims of this paper is to explore both the causes and the potential implications of such a slowdown. Section 2 discusses the evidence both for the slowdown and for its historical development over time. Section 3 explores one particular aspect of this dynamic, namely the puzzle of declining productivity growth, and speculates on the link between this phenomenon and the declining energy return on energy investment. Section 4 elaborates on some of the most important impacts of the decline, particularly in terms of rising income and wealth inequalities.
Finally, Section 5 draws together the threads of the analysis together to propose a novel interpretation of recent ‘crises of capitalism’. Specifically, I argue that rising inequality and the resulting political instability are neither the accidental aftermath of the financial crisis nor the inevitable result of declining growth rates, but rather the consequence of continuing to cling to the ‘growth fetish’ at a time when economic (and resource) fundamentals are operating in the wrong direction. The ‘post-growth’ challenge of the paper’s title is not so much about trying to ‘turn growth down’ but rather about protecting social progress in the face of what some well-known economists are now prepared to call the ‘new normal’.9
2 Secular Limits to Growth
In November 2013, five years after the collapse of Lehman Brothers, the former World Bank chief economist and US Treasury Secretary Larry Summers gave a speech to the International Monetary Fund’s annual research conference which sent something of a shock wave through the audience. He suggested that the slow growth rates and continuing uncertainties of the post-crisis years were not just temporary after-effects of the financial crisis itself. ‘The underlying problem may be there forever,’ he said.10
Summers was certainly not the only, or the first, economist to make such a claim.11 But he was certainly the most well-known economist to do so. The repercussions were profound. It suddenly became acceptable to ask previously unthinkable questions. What if there just wasn’t so much growth to be had anymore? What if sluggish demand was not just a cyclical downturn but a deeper reluctance on the part of business to invest and of consumers to spend, a more entrenched change in economic fundamentals? Could an era of lower growth rates (Figure 1) be the ‘new normal’? 12
Not everyone agreed that the slowdown was a result of sluggish demand. Some argued that the problem was one of supply. US economist, Robert Gordon suggested that a slowdown in the rate of economic growth is the result of a decline in the pace of innovation – many of the big technological advances of the last two centuries are now over – together with six ‘deflationary headwinds’ which are taken to include: an aging population, rising inequality, and the ‘overhang’ of consumer and government debt.13
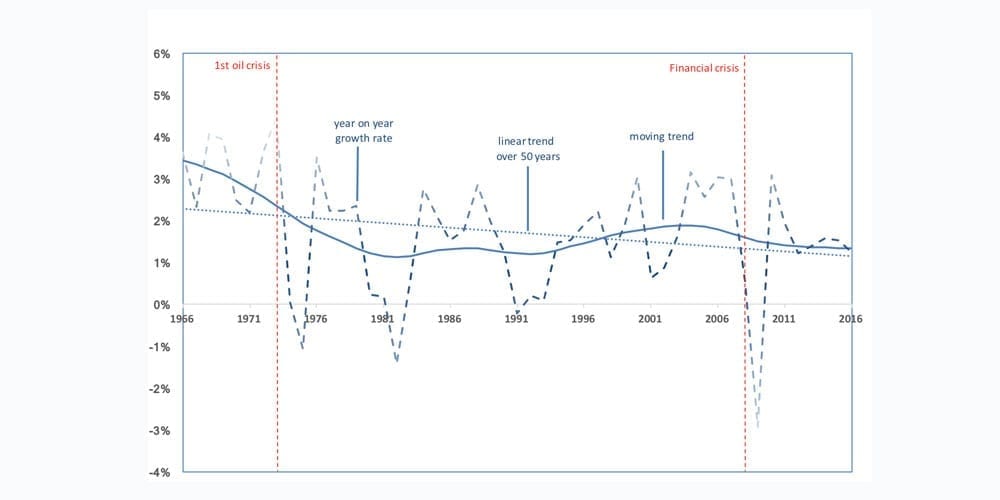
Both the supply-side and the demand-side explanations are interesting from the perspective of this paper. Ecological economists have argued for some time that the enormous growth in productivity of advanced economies was only possible at all because of the abundance of high-quality fossil energy sources.15 Any slowing down in the availability or quality of such sources might be expected, as the Club of Rome suggested back in 1972, to slow down overall productivity and reduce industrial output. Is it possible that the slowing down in supply highlighted by Gordon and others is a direct consequence of these dynamics?
The demand side explanation is more attuned to the possibility that there are social limits to growth. The existence of diminishing returns to income could certainly play a role in the stagnation of demand. In fact, one partial explanation for Japan’s ‘lost decades’ has been that the nation experienced a saturation in consumer demand from an ageing population more inclined to save than to spend. Is it conceivable that social dynamics are now contributing to a demand-side secular stagnation in the advanced economies? Could this already be having a knock-on impact on the global economy?
Economists are divided on whether the slow-down is a result of demand or supply-side forces. Jean-Baptiste Say once argued that ‘supply creates its own demand’ because making things provides people with income which they must then spend back into the economy. If this were really the case, then as long as the supply potential of the economy continues to grow, there should be no bottlenecks on growth. One of John Maynard Keynes’ contributions to economics was to show how this could go wrong, once the demand for money and financial assets came into the picture. If people hoarded money or used it to buy (or speculate in) financial assets, then incomes never find their way back in as demand.
In his response to those arguing that the problem was with supply rather than demand, Summers invoked a kind of ‘inverse Say’s Law’: namely, that a lack of demand could itself create a lack of supply. For reasons similar to those highlighted by Keynes, he argued that a slowdown in demand, combined with increasing investment in financial assets would divert funding away from productive investment, thus diminishing the supply potential of the economy. Perhaps most pertinently, he pointed out that creating more and more cheap money (through low interest rates and quantitative easing) could not solve this problem, because cheap money only encourages speculative lending.16
An even more pressing argument, which I return to in the following section, is that this process of cheap money and increasing speculation tends to inflate asset prices and increase inequality. There have been suggestions that inequality itself has a tendency to suppress growth, partly because richer people have a lower propensity to consume. This accelerates the money hoarding process, increases inequality again and suppressing growth further.17
Whatever the balance between supply and demand side factors, the global implications of a ‘secular stagnation’ are now beginning to become clear. The trend rate of growth in the global GDP was 5.5% in 1966; by 2016 it was little more than 2.5% (Figure 1). The highest global growth rate in the last half a century occurred in the year 1973: ironically, the year of the first oil crisis. By the time of the second oil crisis in 1979, the trend growth rate had fallen to a little over 3%, during which oil prices had effectively quadrupled, after several decades of stability.
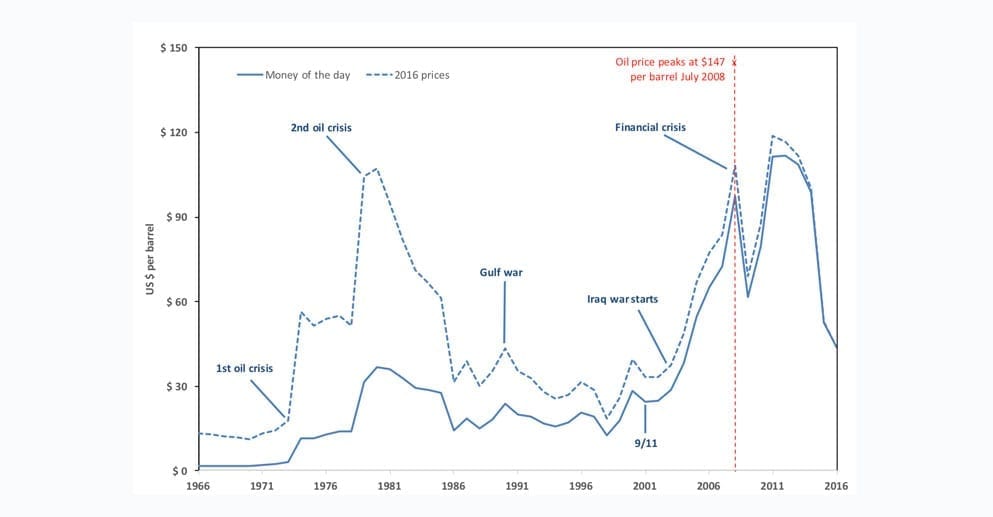
It is plausible that the two successive crises had something at least to do with a subsequent suppression of the growth rate. By 1980, the price of oil (Figure 2) had reached the equivalent of $100/bbl (measured in today’s money). Conventional wisdom would certainly suggest that such price rises would have a profound impact on economic growth by increasing the costs of business and depressing people’s real spending power. The global slowdowns in 1974/5 and 1981/2 are usually attributed to the oil price shocks.
Conventional economics suggests that any real decline in resource quality should be visible in rising prices in the economy, allowing markets to respond efficiently by developing substitutes. What is clear from the history of the last few decades (Figure 2) is that this relationship is much more complex (and volatile) in practice than theory suggests. Substantial price rises did indeed accompany the oil crises. But in the years following the two crises, there was a lengthy decline in oil prices which lasted right through to the end of the 1990s. By 1998, the oil price had fallen to less than $20 (in 2016 prices), lower than it had been for a quarter of a century. During that time (Figure 1), the decline in the growth rate had certainly stabilised. Indeed, the trend global growth rate had actually increased slightly.
At this point, it is useful to introduce the question of government policy, which clearly had some impact both on oil prices and on growth rates in the aftermath of the oil crises and in the run up to the financial crisis. In particular, it’s useful to identify two very distinct approaches, associated with contrasting schools of economic thought: Keynesianism on the one hand, and monetarism on the other.
Developed in response to the Great Depression in the 1930’s, John Maynard Keynes macroeconomics saw a critical role for government in maintaining economic stability. If supply potential was not enough to keep growth going (as Says had argued), governments could not rely on households and firms simply to go on spending during the hard times. They must play an active role in stimulating the economy to ‘kick-start’ growth again. The strategy worked, up to a point, in the wake of the Depression. It was exemplified in particular by Franklin D Roosevelt’s ‘New Deal’ in the States.
The initial response to the slowing down of growth rates in the aftermath of the first oil crisis was Keynesian. Governments attempted to spend their way out of the ensuing recession. The problem was that economic fundamentals were working against this policy. It was not a reduction in demand, per se, that was standing in the way of growth and leading to unemployment, but rather a reduction in real spending power caused by higher prices, resulting in particular from the high price of oil. Having government attempt to stimulate demand further was (momentarily at least) having the perverse impact of simply pushing up prices even further leading to high levels of inflation, with no reduction in unemployment.
Faced with this situation, governments abandoned Keynes and turned instead to monetarism – the brainchild of Chicago school economist Milton Friedman. Built on a neo-liberal philosophy with a strong belief in the free market as the best regulator of human affairs, monetarism had no truck with fiscal stimulus (or indeed with government intervention generally) and argued instead that the route out of low growth was to reduce the cost of money, so that firms would more easily invest in the productive capacity of the economy and households could fund any temporary constraints on spending through debt. These mechanisms for financial liquidity would free up the economy to grow again, allowing prices to fall and employment to bounce back.
The growth rate did recover slightly over the next two decades. Or at the very least, the decline in the global growth rate appears to have been halted. It is not unreasonable to suggest that this stabilisation was in part a consequence of looser monetary policy in the advanced economies during the 1980s and early 1990s.
So when oil prices started to rise again following the attack on the Twin Towers in September 2001 and rising political instability in the Middle East, governments once again thought they knew what to do. A burst of increased liquidity had ‘saved’ the global economy from the crises of the mid-1970s. The thing to do was to continue to ensure that money was available for investors to invest and for households to spend. Governments around the world ushered in a period of cheaper money: a significant decline in the interest rate, a loosening of financial regulation, an unprecedented degree of financial innovation.
There are several lessons from all this. One of them is that the interaction of political instability, government policy and supply-side constraint is capable of masking entirely the simple relationship between price and resource quality. It’s almost impossible for the market to detect what’s going on in terms of resource quality from the visible signal of prices on the market. A second lesson is the potentially damaging impact of volatile prices on the real economy. Though not in itself a signal of underlying scarcity an oil price of $147 a barrel – reached in July 2008 – was certainly instrumental in creating uncertain global economic conditions, even if it wasn’t the immediate trigger for the financial crisis.
Perhaps even more important are the effects of government policy on the stability of the financial system. The policies pursued in the wake of the oil crisis, designed to keep the growth rate going, irrespective of underlying fundamentals, were complicit in generating an increasing fragility in financial markets. Loose monetary policy facilitated a continued reduction in public debt burdens, but the effect was in part at least simply to transfer this debt to the private sector. While interest rates were low and debt burdens were not too high, this didn’t seem to matter much. But as more and more households accumulated more and more debt, the conditions for instability were accumulating.
By the early 2000s, firms, banks and households had become ‘overleveraged’ (Figure 3). The policy response was to pump more and more money into the system by lowering interest rates further and relaxing financial regulations. All it needed was a change in the rate of defaults on ‘subprime’ loans and the bubble would have to burst. This was the era of ‘easy money’, the ‘age of irresponsibility’ as then Prime Minister Gordon Brown called it, and it led inexorably to the financial crisis.18
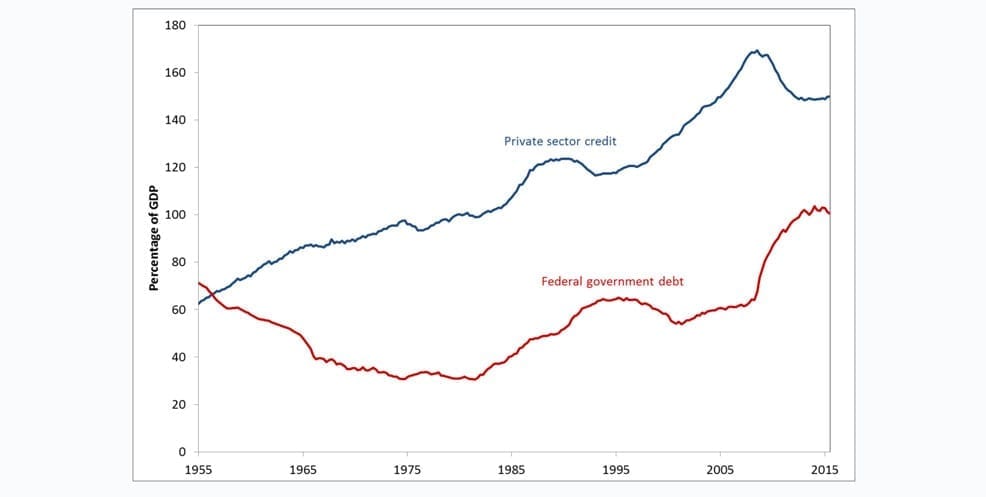
‘The question then arises,’ wrote Summers in 2014, ‘can we identify any stretch during which the economy grew satisfactorily under conditions that were financial sustainable?.’20 His answer, and indeed the answer of a number of other economists, was: no. Chasing growth through loose monetary policy in the face of challenging underlying fundamentals had led to financial bubbles which destabilised finance and culminated in crisis.
One of the key lessons from Figure 3 is the steep rise in public debt following the collapse of Lehman Brothers. In the wake of the crisis, western governments committed trillions of dollars to securitise risky assets, underwrite threatened savings, recapitalise failing banks and re-stimulate the economy in the wake of the crisis.
No one pretended this was anything other than a short-term solution. Many even accepted that it was potentially regressive: a temporary fix that rewarded those responsible for the crisis at the expense of the taxpayer. But it was excused on the grounds that the alternative was simply unthinkable. Collapse of the financial markets would have led to a massive and completely unpredictable global meltdown. Entire nations would have been bankrupted. Commerce would have failed en masse. The humanitarian costs of failing to save the banking system would have been enormous.
But government bailouts precipitated further crises. Country after country, particularly across the Eurozone, found themselves negotiating rising deficits, unwieldy sovereign debt and down-graded credit ratings.21 Austerity policies, brought in to control deficits and protect ratings, failed to solve the underlying issues. Worse, they created new social problems of their own.
The withdrawal of social investment caused rising inequality, deepening unemployment, worsening health outcomes and an increasingly agitated public. The injustice of bailing out the architects of the crisis at the expense of its victims has become plain for all to see. To this day, growth rates have not yet returned to those of the pre-crisis era, let alone to those that characterised the mid 1960s, and the conditions for wider social and political unrest remain palpable.22
3 The Productivity Puzzle
Up to this point, I have presented the story of economic growth over the last half century almost as though it were a single global phenomenon. Clearly, it isn’t. There are signficant differences in particular between the more advanced economies and the emerging market and developing economy countries. Furthermore, these differences have themselves changed over time.
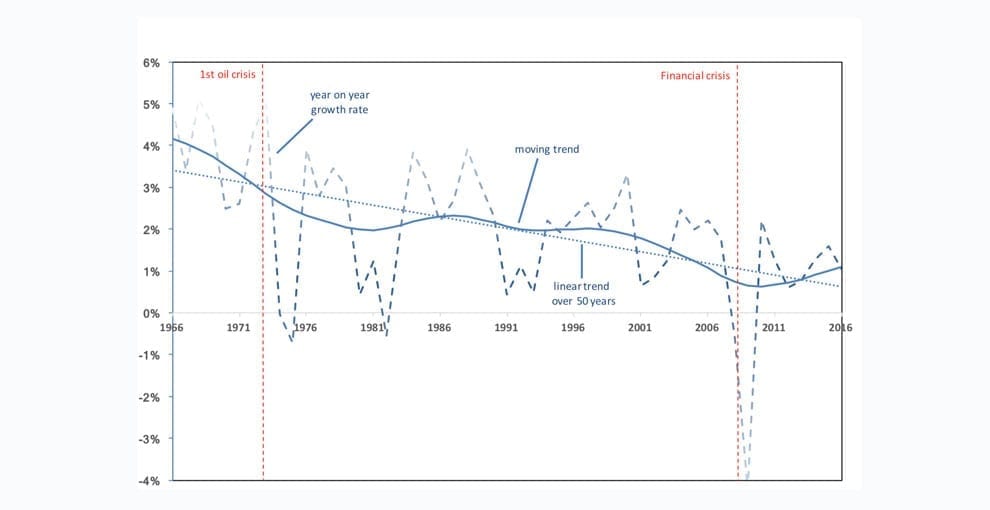
In the mid-1960s, growth in the global economy was dominated by the advanced nations, where the growth rate in per capita GDP was at least half a percentage point higher than the global average and almost five percentage points higher than growth in the developing economies. By the time of the financial crisis that had already changed. Some of the poorest economies in parts of sub-Saharan Africa and South East Asia still had per capita growth rates below 1% per annum. But growth rates in the emerging markets (China, India, Brazil, for instance) had long since overtaken growth rates in the OECD nations. In the advanced economies, meanwhile, per capita growth had fallen substantially from its mid 1960s peak of around 4% to something closer to 1% per annum (Figure 4).
The significance of this fall is perhaps best captured by extrapolating forwards to the point at which the growth rate reaches zero. Whereas for the global GDP per capita (Figure 1), the point at which growth disappeares is more than 60 years into the future, for GDP per capita in the OECD nations, the point is brought forwards dramatically. In less than a decade, on current trends, there would be no growth at all in GDP per capita across the OECD nations.
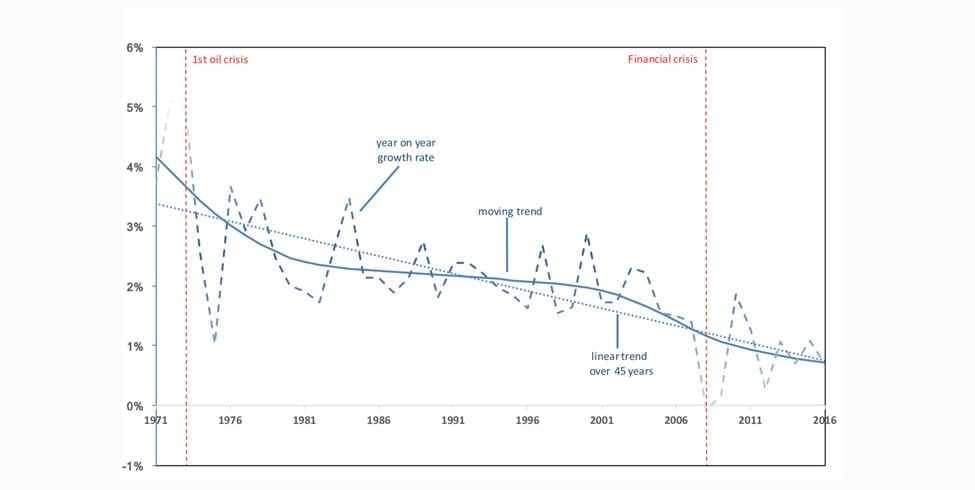
A part of the reason for the steepness of this fall, of course, is the severe recession during and after the financial crisis, which was deeper for the OECD nations than it was for other parts of the world. In fact, the moving trend appears to show a pronounced upturn since that time, indicating perhaps that the OECD nations are able to ‘turn the corner’ and achieve higher growth levels again. A closer look at the reasons for this upturn, however, suggests caution in interpreting the trend in this way.
Figure 5 shows the year-on-year growth in labour productivity – defined as the GDP produced per hour worked on average across the economy. Though labour productivity growth starts out in more or less the same place as the growth in GDP per capita at the start of the period, the speed of decline is noticeably faster, there is no partial recovery in the aftermath of the second oil crisis and there is nothing in the way of an upturn during the final years. Labour productivity was growing at only 0.7% per year in 2016, significantly slower than the growth in GDP per capita.
These differences between the GDP per capita growth and the underlying labour productivity growth have important implications. Labour productivity is defined here as the GDP generated (on average) by each hour of labour worked in the economy, that is the GDP divided by the total hours worked in the economy. The total hours worked in the economy can be characterised as the average hours worked by each person in the workforce multiplied by the number of people in the workforce. The number of people in the workforce can also be written as the population multiplied by a ‘workforce participation rate’.
A little mathematics reveals that the GDP per capita is equal to the labour productivity multiplied both by the workforce participation rate and the average number of hours worked by each member of the workforce. If the workforce participation rate and the average hours worked were to remain constant, the GDP per capita would be directly proportional to the labour productivity.23 In this case, the growth rate in GDP per capita would always be equal to the growth rate in labour productivity. It is evident from Figures 4 and 5 that this is not the case.
Specifically, growth in labour productivity has declined faster than growth in the GDP. Mathematically, this means either that the workforce participation rate has risen over time or else that the average number of hours worked by each worker in the economy is increasing. In fact, both of these things have happened at different times during the last half a century or so. Until recently, the average hours worked had been declining across most the OECD but participation rates had increased, allowing the growth rate in GDP per capita to decline more slowly than the decline in labour productivity growth. Since the financial crisis, there has been an increase in the average hours worked across many advanced economies, including the UK and the US. People are working longer hours in order to sustain their desired income levels.24
The broad point is that the rate of labour productivity growth tells us something fundamental about the capacity of the economy to deliver income growth. It is central to our understanding of how hard people have to work in order to sustain a given income level. Specifically, when labour productivity growth across the economy declines faster than the growth in average income, it means that people on average must work longer hours for that income. Figure 5 suggests that, on current trends, labour productivity growth will decline to zero across the OECD by around 2028. In about a decade, it is entirely possible that per capita GDP growth could only be achieved by having a greater proportion of the population in the workforce or by having people work on average for longer hours.
This finding is particularly puzzling in the face of a completely opposite proposal, namely that advances in technology (specifically, in artificial intelligence and robotisation) are poised to make such massive increases in labour productivity that vast swathes of the current workforce, far from being asked to work for longer, will find themselves redundant because there is no longer enough work for human beings to do. The jury is still out on where (in which sectors) this displacement is most likely to occur, when it is likely to arrive and the extent to which it will be a good or a bad thing for the economy as a whole. The most puzzling question is why it is not already visible in the labour productivity statistics.
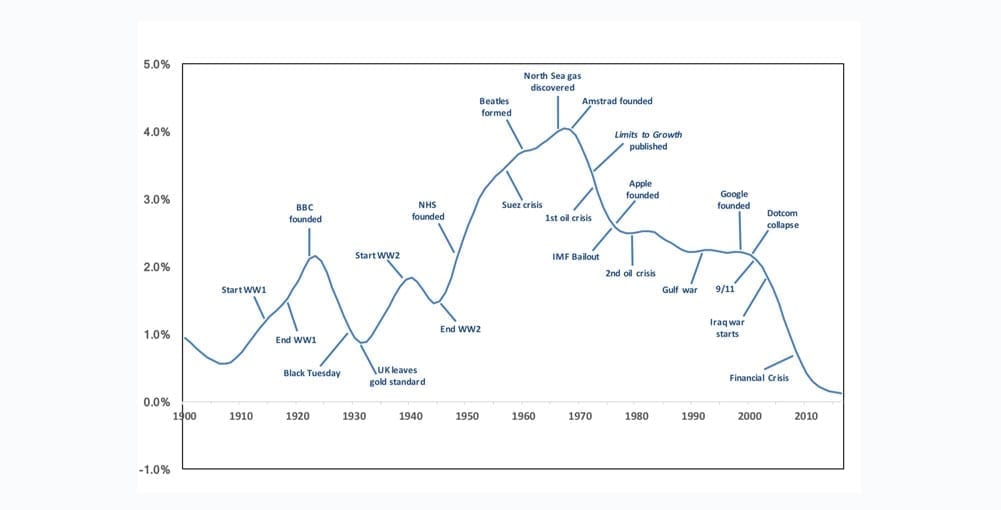
To get a better sense of this puzzle, it is worth looking in more depth at the longer term trend in labour productivity growth in a particular country – in this case the UK – for which a long time-series on labour productivity exists. The UK was the first country to industrialise, it typifies the structure of late-modern western economies, and may well be facing the challenges of post-industrialism sooner than other OECD countries. Understanding the trend in labour productivity growth in the UK therefore offers a useful starting point to understanding the challenges to the future of economic growth more widely.
Figure 6 shows the trend in labour productivity growth in the UK since the beginning of the 20th Century. It is an extraordinary story. Broadly speaking, trend labour productivity growth rose more or less continually from the beginning of the century until about the mid-1960s, aside from ups and downs related to the two world wars and the Great Depression. Since the mid-1960s however, with virtually no remission at all, the trend in labour productivity growth has been falling. This fall was at best slowed down, but never entirely reversed by the introduction of extraordinary new technologies such as personal computing, electronic communications and the internet.
The period between the second oil crisis and the collapse of the dotcom bubble at the turn of the millennium witnessed a kind of plateau in labour productivity growth. Certainly the decline was not so fast during these years. But since 9/11, labour productivity growth in the UK has dropped precipitously. It’s particularly important to recognise that this decline preceded the financial crisis itself by at least a decade (from the post oil crisis plateau) and more likely by several decades. By 2016, the trend labour productivity growth rate in the UK was just 0.12%, lower than at any point in more than a century.
Again, to be clear, the only way to squeeze economic growth out of an economy with virtually no productivity growth at all is to have a higher workforce participation or to have people working longer hours. The clear rise and fall of the trend therefore carries some important lessons about the development of modern society, the potential for income growth and the relationship to people’s work-life balance and standard of living.
It may also have some bearing on the discussion in preceding sections. There is no common agreement as to the causes of the pattern shown in Figure 6. The suggestion that the rise and fall of productivity growth is associated with the availability of physical resources such as energy and minerals is clearly one that merits further attention. The similarity between the rise and fall in labour productivity shown in Figure 6 and some recent studies of the energy return on energy invested (EROI) in fossil fuels is striking.
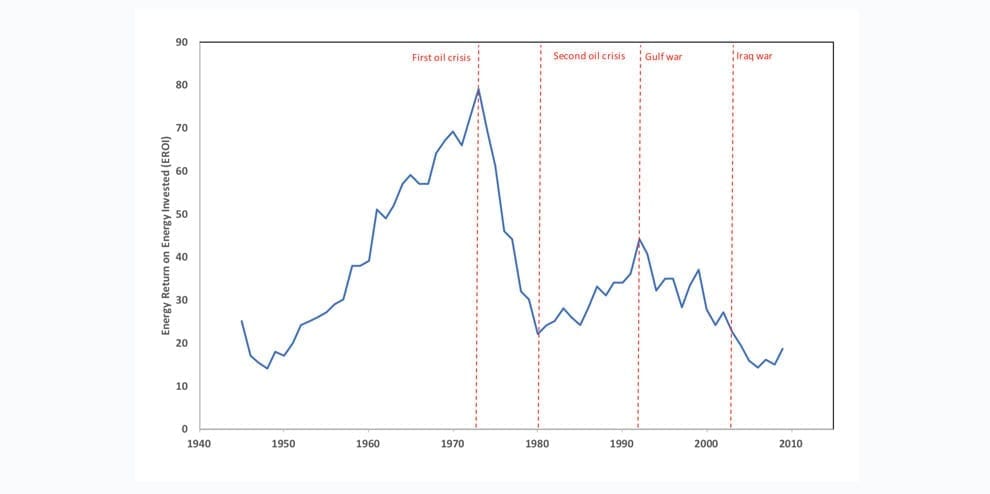
Figure 7 shows the rise and fall of EROI in oil and gas production in Canada between the end of the second world war and the financial crisis. It illustrates clear rise and fall in EROI over the time period. A similar study for the US found that the EROI of US oil and gas production increased from around 16:1 in 1920 to around 30:1 in 1970. Subsequently, however, the EROI declined and in 2010 was estimated to be only 10:1. Most EROI studies across multiple countries show declining EROI in the last two to three decades. So the idea that the rise and fall in labour productivity growth has something to do with the underlying physical resources is certainly not fanciful.25
On the other hand, Figure 6 doesn’t particularly support the idea that secular stagnation is a demand-side phenomenon. Labour productivity can decline in an economy in recession, because of labour hoarding – firms hang on to people rather than letting them go, in expectation that things will get better soon and in the hope of avoiding rehiring costs. For this reason, labour productivity growth tends to fall naturally during a recession. But the sustained decline in labour productivity growth witnessed during the last 5 decades suggests a much less cyclical trend, which can’t quite be explained through labour hoarding.
Another possible candidate for the decline is the structure of both demand and supply. Late modern economies are characterised by a shift from primary and secondary manufacturing of material products towards the provision of services. This shift occurs both in the supply structure of the economy (for a variety of reasons) and the demand structure. On the supply side, there is a tendency for advanced economies to export basic extraction and processing activities to countries with lower labour costs and lower environmental regulations.
On the demand side, it is possible that, once basic material needs are satisfied, people turn more to service-based activities as the destination for disposable income, rather than to even more material products. Service-based activities are generally understood to be less amenable to growth in labour productivity – partly because the core-value proposition in such activities relates to the time spent by human beings in delivering the service. In other words a mixture of demand side changes and the supply side implications of those changes could be behind the decline witnessed in Figure 6.26
Finally, it is possible that the financial structure of the global economy plays some role in the plight in which advanced economies in particular appear now to find themselves. In support of growth, advanced economies in particular have attempted to increase liquidity through a mixture of financial innovation, low interest rates, and (more recently) direct monetary financing (particularly of the financial sector itself). This has tended to stimulate speculative investment at the expense of productive investment in the real economy. Whether this has held back labour productivity growth is not entirely clear. It has certainly made it more difficult to invest in the transition to low-carbon and resource efficient technology which might offset the environmental limits to growth. It has also had some profound social and political implications, as we shall now see.
4 The Age of Inequality
In 2014, the French economist Thomas Piketty published his treatise on Capitalism in the 21st Century. It was an immediate, if unlikely, best-seller: a voluminous economic text book that had a global impact. Its fame rested on two main features. The first was the spotlight that it shone on rising inequality, particularly in the advanced economies. Specifically, Piketty and his colleagues showed that the post-tax income of the richest percentiles of the US population received a rising share of the national income over the past half century. By 2015, the richest 10% of the population received almost 40% of the national income, higher than at any time since 1945. The post-tax income share of the richest 1% had risen even faster than that of the top 10%, and by 2015 stood at over 15% of the national income, higher than at any point since 1940 (Figure 8).
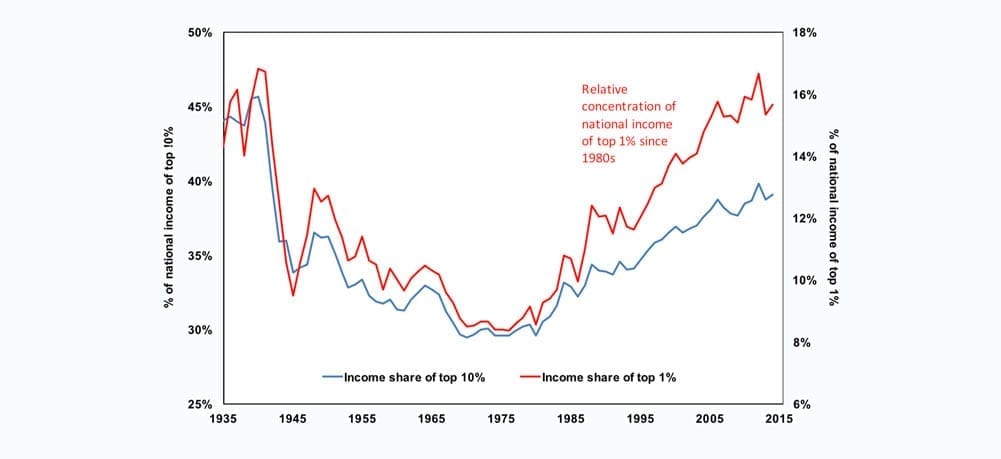
The second striking feature of Piketty’s bestselling work was a particular argument about the causes of rising inequality. Specifically, the French economist argued that rising inequality was a direct and inevitable result of the declining growth rate. There are various heuristic arguments to support this view. Certainly, there’s an uncanny inverse resemblance between the U-shaped curve shown in Figure 8 and the inverted U-shaped curves shown in Figures 6 and 7. Could it be that rising economic growth, built on increased labour productivity, is precisely what allowed society to reduce inequality through the first half of the 20th Century?
This was precisely the idea behind what became known as ‘trickle-down’ theory: the hypothesis that economic growth is the best (and perhaps only) way to bring poor people out of poverty and reduce the inequality that divides society and undermines political solidarity. It was President Kennedy who popularised the idea that a ‘rising tide lifts all boats’. Wealth generation for the richest should flow back into society as the rich spend their income on more and more goods and services. Setting aside for the moment the environmental impacts of this increased throughput, the process should at least allow for income growth amongst the very poorest, who would find employment in the manufacturing sectors that provided for this increasing expenditure. With labour productivity rising, production costs would fall, allowing employers to compensate their employees with ever higher wages. With more spending power in the economy generally, even the poorest sectors of society would be encouraged to spend more into the economy. And so the virtuous cycle would continue.
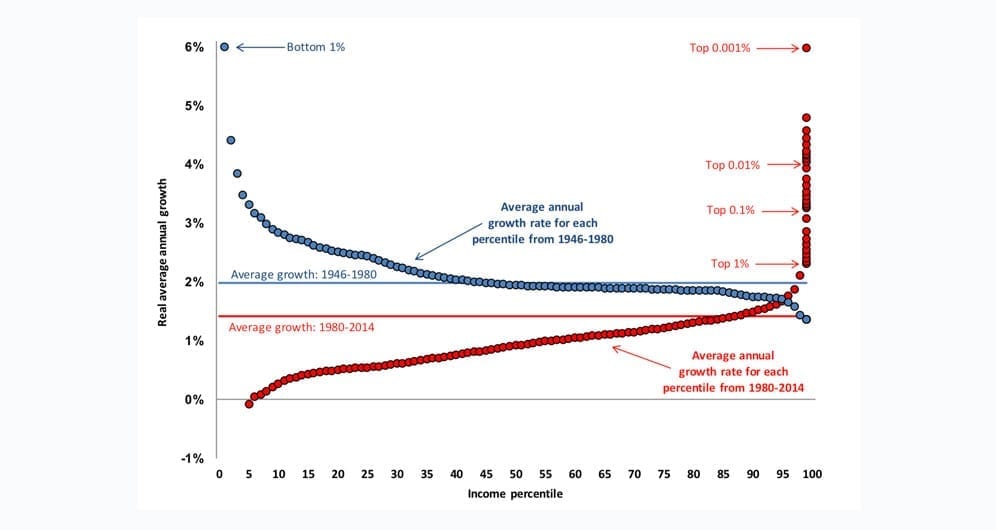
In fact, as Piketty and his colleagues have shown, in the immediate post-war years, the benefits of growth did flow predominantly to the poorest in society. Between 1946 and 1980, the lowest income percentiles in the US received the highest income growth, while the highest income percentiles received the lowest income growth. The average real growth in per capita GDP during the period was around 2%. Average income growth in the lowest percentile was three times this, at 6%, while income growth in the richest percentile was little more than half the economy wide average (Figure 9 – blue lines and markers). Not surprising then, that inequality was broadly declining over that period.
In the period since 1980, the story has been a very different one. Average income growth in the US was lower to start with, at only 1.4%, on average between 1980 and 2014. But the striking part of the story was the reversal in the fortunes of the poorest and richest as beneficiaries of that growth. The incomes of the bottom 50% of the population grew at a meagre 0.6%, only half the average rate of growth of the economy as a whole, while the incomes of the richest 5% grew at 1.7% per annum, significantly above the average income growth (Figure 9 – red lines and markers).
The story within the story is even more striking. Since 1980, it was increasingly the super-rich who benefited from whatever growth the economy could provide. The average growth rate of the top 0.001% of the population was over 6%, allowing them to increase their post-tax earnings by a factor of seven over the last three decades. The poorest 5% saw their post-tax incomes fall in real terms over the same period.
Could declining labour productivity growth have had something to do with this story? In theory, yes. Neoclassical economics assumes that wage growth follows labour productivity growth. If each hour of work is 2% more productive each year, then in theory, employers can afford to pay workers a 2% rise, without facing any additional costs. But when labour productivity growth is falling or stagnant, wage growth is also sluggish, so that even when GDP growth is buoyed up by fiscal or monetary policy, it tends to leave workers on the whole less well off in the economy.
Figure 10 illustrates the relationship between labour’s share of income and inequality in the US. It illustrates clearly the role that declining wage share has had in rising inequality. Since the turn of the millennium in particular, workers have seen less of the national income than the owners of capital. Some of this decline could certainly be associated with the decline in labour productivity.
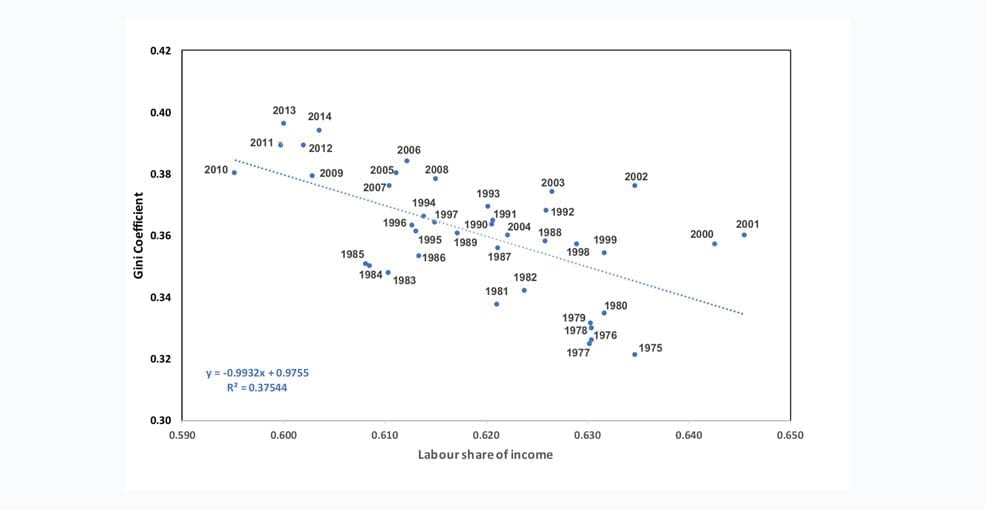
When workers have more power than employees, for instance when the employment rate is very high, then wage growth can exceed labour productivity growth. Typically, this leads to higher costs for producers, which must either be absorbed out of profits or else passed on to consumers, leading to inflation, and potentially depressing the economy. On the other hand, when employers have more power than workers, for instance when unemployment is high and there is a surfeit of labour, they can depress wage growth and reap the rewards of productivity growth as increased profits.
These dynamics appear to have favoured the bargaining power of capital over the bargaining power of labour in recent years. Certainly, one of the challenges of recent years is that, as productivity growth has slowed down, the rate of labour compensation has been suppressed considerably below the growth in labour productivity. Specifically, since the first oil crisis, cumulative growth in the wage rate has fallen substantially below cumulative growth in labour productivity (Figure 11).
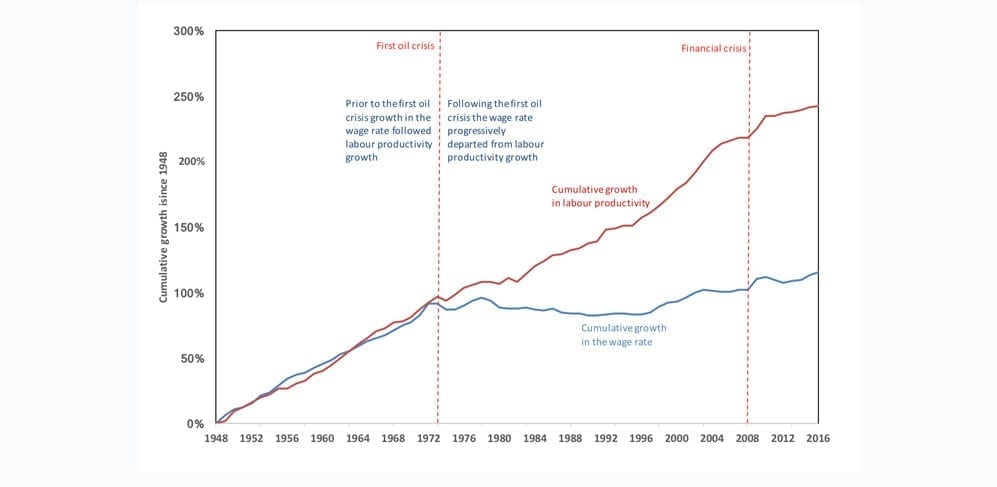
Policy is critical in determining the effect of underlying economic factors on social inequality. In the advanced economies over the last decades the balancing act of fiscal and monetary policy has been to try and keep growth going, while maintaining low levels of inflation. But a fall in the underlying labour productivity growth has made this task increasingly difficult. We have already seen how financial deregulation in pursuit of economic growth was one of the factors leading to the financial crisis in 2008/9. Another of the effects of this loose monetary policy was to exacerbate inequality.
There are several channels through which this acceleration of inequality occurs. In the first place, cheap money leads to financial speculation. Those with access to capital can achieve substantial capital gains as asset prices rise. When wealth is already unequally distributed, this tendency leads directly to higher income inequality. As income inequality increases, it leads to excessive investment funds, because richer households tend to have a high propensity to save than poorer ones. This excess of savings leads to more speculation, pushing asset prices up again and accelerating inequality further. But it also depresses growth, partly through the reduced spending power of poorer households and partly through the crowding out of investment in the real economy. Policy responses which attempt to stimulate investment by reducing the interest rate, end up making money cheaper and incentivising more speculation, fuelling a vicious cycle of rising inequality.27
The news is not all bad. Across countries, inequality has declined in recent decades. The global Gini coefficient fell from almost 70 in 1988 to 62.5 in 2013, as the emerging and developing nations began to catch up with the advanced economies.28 Within these emerging and developing economies, inequality has also declined – although Gini coefficients in such countries tend still to be considerably higher than they are in advanced economies. But across the advanced economies, inequality has increased and its consequences are threatening to destabilise western democracy and undermine political legitimacy.29
All of this appears to support the hypothesis that rising inequality is an inevitable result of a declining growth rate. Not only does a decline in labour productivity leave wage earners less well off than the owners of capital, but this trend appears to be exacerbated by factors which have depressed wage growth in the advanced economies well below labour productivity growth, leading to further inequality.
It is tempting at this point to accept Piketty’s case in its entirety: “Capitalism in the 21st Century is faced with inevitable and rising inequality, precisely because the growth rate is slowing down”. There are two core strands to Piketty’s argument in defence of this claim. One of them concerns the power that accrues increasingly to the owners of capital, once the distribution of both capital and income becomes skewed. The power of accumulated or inherited wealth to set the conditions for the rates of return to capital and labour increasingly favours the owners of capital over wage-earners and reinforces the advantages of the rich over the poor. This certainly seems to be visible in the US data (Figure 11).
The other part of Piketty’s argument is a formal derivation which attempts to relate the share of income flowing to the owners of capital as a function of the growth rate. Specifically, Piketty shows that capital’s share of income is directly proportional to the rate of return on capital multiplied by the savings rate and inversely proportional to the growth rate. This inverse proportionality on the growth rate means that, all things being equal, as the growth rate falls, the share of income going to the owners of capital will rise. Unless the distribution of capital is itself entirely equal (a situation which clearly does not pertain at the moment) the relationship therefore presents the spectre of an explosive rise in inequality as the growth rate declines to zero.30
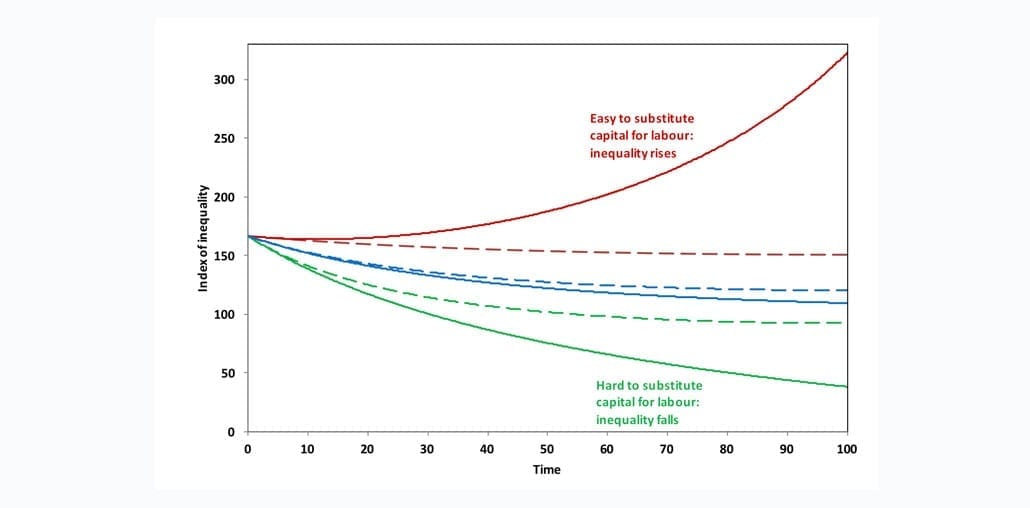
In fact, it turns out (Figure 12) that the ceteris paribus clause is absolutely vital. The behaviour of the share of income going to capital depends crucially on what happens to the savings rate in the economy. It also depends on what happens to the rate of return on capital, and this in its turn depends on something called the elasticity of substitution between labour and capital – broadly speaking the ease with which it’s possible for the owners of capital to substitute capital for labour. If the savings rate remains constant (as Piketty assumed) and it is relatively easy for the owners of capital to protect their returns by substituting away from costly labour with cheap capital, then it is indeed possible for income inequality to rise explosively as growth rates decline.
However, there is absolutely no inevitability at all that a declining growth rate leads to explosive (or even increasing) levels of inequality. If the savings rate remains constant, but the elasticity of substitution between capital and labour is low, a radically different future emerges, wage labour is protected, the rate of return on capital falls as capitalists continue to try and save, but income inequality declines significantly.
In reality, this latter scenario is not particularly likely to occur. It is more likely that any decline in the rate of return on capital would lead to a declining savings rate. When this happens, the economy is considerably less sensitive to the substitutability between labour and capital. Rates of return fall more or less slowly according to whether the elasticity of substitution is (respectively) lower or higher, but in both cases remain comparable with those achieved in a growing economy. Income inequality falls in both cases, even before fiscal interventions. Not surprisingly, fiscal interventions are considerably more effective in such an economy than in one with constant savings and high elasticity of substitution.
The most worrying counter-example is the case where there is a continual increase in the capital-to-output ratio and a high substitutability between capital and labour. It is possible to envisage scenarios in which this occurs. For instance, with increasing automation dominated by relatively few companies with a high degree of monopoly power over labour, there are clearly conditions under which income inequality increases significantly, posing exactly the dangers that Piketty has highlighted.
On the other hand, it is possible to envisage circumstances in which there is far less substitutability between labour and capital even under conditions of rising capital to output ratio such as those that might prevail in the transition to a low-carbon economy. This would of course involve protecting the quality and intensity of people’s time in the workplace from substitution by the owners of capital. But such a proposal is not a million miles from suggestions that government should act as ‘employer of last resort’ in stabilising an unstable economy.32
In short, the idea that rising income inequality is an inevitable consequence of falling growth rates is fundamentally wrong. On the contrary, an economy with a declining growth rate might equally be headed towards lower income inequality and greater stability of employment. The choice, it turns out, lies in the underlying structure of economic relations and, in particular, in the relations between labour (the workforce in paid employment in the economy) and capital (the owners of productive and financial assets).
5 Confronting the Post-Growth Challenge
A decade after the onset of the financial crisis, governments around the world are as wedded to the goal of economic growth as they have ever been. The expectation is that a return to ‘normal’ levels of growth will not just solve our economic woes, but is the only possible way to bring poor people out of poverty.
In the name of growth, successive governments have justified austerity, reduced their commitments to welfare spending, cut taxes for the richest and withdrawn vital safety nets for the poorest in society. These regressive policies are busy compounding the injustice of income inequality with something even worse: inequalities in healthcare, in longevity, in basic security, in human dignity. These new and deepening inequalities are beginning to undermine the social fabric of society and threaten political stability.
The same strategy is depleting finite resources and placing increased risks on the environment. Declines in the quality of physical resources are already evident and the dynamics of depletion place ever greater costs on society. Authoritative estimates of the costs associated with unmitigated climate change are salutary. Without investment in newer cleaner technologies, these additional risks will also depress the potential for growth.
Behind these conditions lies a steady decline in the rate of growth of labour productivity, stemming from roughly half a century ago (Figure 6). The reasons for this decline are contested. Some point to a variety of secular ‘headwinds’ – such as rising debt overhang – which slow down demand, as well as to basic technological factors that put the brake on supply. Others have pointed to a diminution in demand in the advanced economies in particular.
There remains a disturbing possibility that the huge productivity increases that characterised the early and middle twentieth Century were a one-off, something we can’t just repeat at will, despite the wonders of digital technology. A fascinating – if worrying – contention is that the peak growth rates of the 1960s were only possible at all on the back of a huge and deeply destructive exploitation of dirty fossil fuels (Figure 7); something that can be ill afforded – even if it were available – in the era of dangerous climate change and declining resource quality. Low (and declining) rates of economic growth may well be the ‘new normal’.
The critical question is how policy should respond to this not-so-new reality. Over the last few decades, capitalism has had a very specific response. From the early 1970s onwards, falling labour productivity growth has been rewarded with even lower wage growth (Figure 11). Faced with diminishing returns, producers and shareholders have systematically protected profit by depressing the rewards to labour. Governments have encouraged this process through loose monetary policy, poor regulatory oversight and fiscal austerity. The outcome for many ordinary workers has been punitive. As social conditions deteriorated, the threat to democratic stability has become palpable.
The prevalent ‘rescue narrative’ relies on an assumption that productivity growth will recover, primarily through new technological breakthroughs. Candidate ‘saviours’ in these rescue narratives are various. For some, innovation will arrive from investment in the same clean, low-carbon technologies that are needed to tackle climate change and offset resource depletion. For others, innovation will come from a new digital revolution: increased automation, robotisation, artificial intelligence.
But the conditions for any of this enhanced investment remain uncertain at best. Financial instability, debt overhang and rising inequality haunt the financial ecosystem within which these new investment portfolios must flourish. The dynamics of loose monetary policy continue to favour speculation in financial assets rather than investment in the productive capacity of the economy.
The low carbon investment scenario is particularly vulnerable to policy uncertainty. Without clear regulatory guidance or a market price on carbon, leveraging the trillions of dollars of investment needed to meet climate change targets looks extremely challenging. Commitments to the Paris Agreement have yet to be met with clear delivery plans.
The two investment strategies may also turn out to be in competition with each other. While some believe that enhanced automation will reduce our overall carbon footprint, the current evidence for this is at best partial and mostly anecdotal. It is essentially a strategy that substitutes capital for labour on a massive scale. Since capital assets require material inputs, the likelihood is that it will have a higher resource footprint and higher carbon emissions than a strategy that is more labour intensive.
The social consequences of increased automation might be even more unpalatable than the environmental impacts. In particular, without quite radical policy intervention, including a massive redistribution in the ownership of capital assets, the enhanced automation scenario is likely to lead to an unequal and increasingly polarised society. Of particular concern is that these technologies are qualitatively different from those which produced the massive rise in productivity growth up to the mid 1960s.
The technological revolution of the 19th and early 20th Century tended to increase the potential for workers to improve their productivity of their labour. This led to higher wages and greater spending power in the economy. The expansion of consumer demand provided a further stimulus to growth and productivity improvement. Putting technology in the hands of workers created new jobs in the economy and allowed for a general improvement in the quality of life of citizens.
There is a real danger that new digital and robot technologies will remove the need for whole sections of the working population, leaving those who don’t actually own the technologies without income and without bargaining power. Meanwhile the owners of these technologies are likely to acquire unprecedented market power, and the conditions for ordinary workers will deteriorate even further. This is essentially the world described by the upper line in Figure 12 above, in which it becomes easy to substitute capital for labour, difficult to maintain demand and impossible to stop inequality rising steeply.33
Reaching beyond these potentially destructive conditions is not impossible. There is an emerging interest in ideas around de-growth and in the economics of a potential ‘post-growth’ society.34 These approaches tend to accept that beyond a certain point, and for a variety of reasons, economic growth is neither desirable nor indeed feasible. Whether for secular reasons, or from a decline in resource quality, or from the need to curtail damaging environmental impact, proponents of these ideas attempt to envision the social conditions (and economic implications) of a world in which, for the advanced economies at least, it is necessary to do without growth.
Addressing inequality under such conditions is a particular concern. Reaching one or other of the worlds described by the lower lines in Figure 12 requires us to confront certain fundamental aspects of capitalism. For example, without a proactive distribution of resources, it is difficult to see how the social devastation of a highly unequal society is to be avoided. Without proactive labour and income policies, it is difficult to see how incomes for ordinary people can be maintained, let alone improved. And without state investment, it is difficult to see how basic services can be maintained for the majority of the population.
A key issue for government, in conditions of declining growth, is the ability to maintain the fiscal headroom within which to protect democratic legitimacy. Electorates tend to punish administrations badly when social investment falls. If declining growth is met with fiscal austerity it is likely to lead to progressively worse social outcomes and increasing political fragility.
One way in which government may attempt to improve this situation is through recovering political control over the creation and supply of money. Some surprisingly conventional voices have called for an end to banks’ power to create debt-based money and the implementation of a so-called ‘sovereign money’ system.
A recent IMF working paper identifies several clear advantages to this, better control of credit cycles, the potential to eliminate bank runs, and dramatic reductions in both government and private debt. Under such a system the state would no longer have to raise money for investment and welfare on commercial bond markets. Instead they could spend directly into the economy, as and when financing was needed, subject only to the caveat that such spending was non-inflationary. Proposals for such systems are currently under consideration in Iceland and in Switzerland.35
Such ideas tend to be regarded at best as marginal distractions by mainstream economists and at worst as obstacles to growth. Sectors which make vital contributions to our quality of life, provide decent work, and substantially reduce our material footprint are derided as ‘stagnant’ because they have a lower potential for labour productivity growth. Social investment is seen as irrelevant to the pursuit of profit.
In a growth-obsessed world it is easy to end up overlooking the parts of the economy that matter most to human wellbeing. By understanding and planning for the conditions of the ‘new normal’ associated with low growth rates, it is possible to identify more clearly the features that define a different kind of economy. A simple shift of focus opens out wide new horizons of possibility.
Another such ‘backstop’ policy, which has received increasing attention recently is the idea of a universal basic income. When the availablity of wage labour declines and the downward pressure on wage growth increases, the dynamics of inequality sharpen considerably. In the absence of policy measures to combat these conditions, they are likely to lead to further stagnation in demand and increasing political instability. The provision of a universal basic income at a level sufficient to ensure basic minimum living standards could do much to offset these destabilising influences.36
Elaborating on these ideas is beyond the scope of this paper. Rather, my principal aim has been to tease out the underlying dynamics of a global economic and social system in crisis. In the process I have attempted to illustrate more precisely how the strategy of chasing after growth in the face of challenging fundamentals is leading to rising instability and the fractured politics of a deeply unequal world.
But the suggestion that rising inequality is somehow an inevitable result of a decline in the growth rate is fundamentally wrong. More correct would be to argue that rising instability (both social and financial) is result of trying to protect the growth rate in the face of an underlying decline in productivity, by privileging the interests of the owners of capital over the interests of those employed in wage labour in the economy. Reversing this trend by raising the labour productivity growth rate through selective technologies is a highly uncertain strategy that may exacerbate the environmental and social problems of the 21st century.
In the light of that analysis, it is clearly pertinent to look beyond the outcomes associated with the continued pursuit of the prevailing economic paradigm. Elsewhere, I have argued that the task of elaborating a less capitalistic, more resilient post-growth economy is precise, definable, meaningful, and pragmatic. 37
Clearly, such ideas fly in the face of much conventional wisdom. They will be most challenging of all for highly capitalistic societies. But the dangers for capitalism are not confined to the challenge from emerging economies for whom the transition may be easier. The dynamics of the existing growth-based paradigm are driving environmental damage, exacerbating social inequality and contributing to increased political instability. There has never been a more urgent need to question the growth imperative. There has never been a more opportune time to develop the design concepts for a resilient post-growth society.
Notes
[1] For the history of this see, amongst others: Coyle 2014, Philipsen 2015, Victor and Dolter 2017).
[2] The term GDP fetish was coined by Nobel Prize Winner Joseph Stiglitz (2009) but the idea has roots in the writings of various other critics such as Douthwaite (1992) and Daly (1977 and 1996).
[3] Meadows et al 1972. For a retrospective assessment see also Turner 2008, and Jackson and Webster 2016.
[4] ‘Remarks at Convocation Ceremonies at University of South Carolina, September 20th 1983. Online at: http://www.reagan.utexas.edu/archives/speeches/1983/92083c.htm.
[5] See Boulding 1973.
[6] For the earlier incarnations see von Weizsäcker et al 1995, Mol 2001; for the later revival of eco-modernism see (eg) Breakthrough Institute 2015.
[7] See for example Daly 1977, Waring 1988, Douthwaite 1992. On the social limits to growth see Easterlin 1974, Hirsch 1977, Layard 2005).
[8] For an overview of these critiques see Jackson 2017. See also: D’Alisa et al 2014, Dietz and O’Neill et al 2013, Raworth 2017, Fioramonti 2015, Victor 2018.
[9] See Ford 2015; see also: Summers 2014, Galbraith 2014, Storm 2017.
[10] Summers 2014; Summers 2018.
[11] The term ‘secular stagnation’ had first been coined by Alvin Hansen in his Presidential Address to the American Economic Association in 1938 (Hansen 1939) to describe a situation in which economic fundamentals pointed to serious problems for the growth paradigm.
[12] See Galbraith 2014. For a useful overview on secular stagnation see the collection of essays edited by Teulings and Baldwin 2014.
[13] Gordon 2012, 2016.
[14] The Hodrick-Prescott (HP) filter is a statistical tool used to remove the cyclical component of macroeconomics data and expose the underlying long-term trend. See for example: https://en.wikipedia.org/wiki/Hodrick%E2%80%93Prescott_filter. The value of the parameter lamda chosen for this analysis is typical for time series data with an annual frequency. Note that the linear trend associated with the HP filter is the same as the linear trend associated with the underlying data.
[15] Ayres and Warr 2009, Ayres 2008, Georgescu-Roegen 1972, Daly 1977.
[16] See for instance: https://www.cbpp.org/blog/summers-lack-of-demand-creates-lack-of-supply.
[17] Credit Suisse 2014, IMF 2017
[18] See Jackson 2017, Chapter 2, for a fuller discussion. See also Wolf 2014, Turner 2015.
[19] Data on domestic private credit held by households and by non-financial institutions are taken from statistics held by the Bank for International Settlements, online at: http://www.bis.org/statistics/totcredit/credpriv_doc.pdf. Data on the national debt are taken from the Federal Reserve website: https://research.stlouisfed.org/fred2/series/GFDEGDQ188S/.
[20] Summers 2014, 68.
[21] Felkerson 2011.
[22] On rising inequality, see for example: Piketty 2014; Credit Suisse 2014; Oxfam 2014. On health outcomes from austerity see Stuckler and Basu 2014.
[23] If lp is labour productivity, N is the workforce, P is the population, n = N/P is the workforce participation rate and h is the number of hours worked on average by each member of the work force, then it follows first that GDP = lp * h * N and therefore that GDP per capita = GDP/P = (lp * h * N)/P = lp * h * n. When h and n are constant, GDP is directly proportional to lp.
[24] See OECD 2017.
[25] See Hall et al 2014 for an overview of some recent studies. See also Guilford et al 2011, Friese 2011, Poisson and Hall 2013.
[26] See Jackson 2017, Chapters 8 and 9 for a fuller discussion of this point. See also Baumol 2012.
[27] See Credit Suisse 2014, p34, for a discussion of this dynamic.
[28] See eg IMF 2017, p4.
[29] See Streeck 2015 for a particularly bleak take on this.
[30] Piketty 2014, p 160 et seq; see also Krusell and Smith 2014.
[31] Jackson and Victor 2016; 2017. Households are divided into ‘capitalists’ who hold most of the capital assets and workers whose incomes mainly come from wage labour. The index of inequality is calculated as the ratio of capitalists to income workers indexed so that 100 represents equality.
[32] See for example Minsky 1986. For a fuller elaboration of these different scenarios of inequality in the event of declining growth, see Jackson and Victor 2016; 2017.
[33] For a fuller discussion of this point see Ford 2015.
[34] See for example, D’Alisa et al 2014, van den Bergh 2015, Kallis 2015, Jackson 2017, Victor 2018.
[35] Benes and Kumhof 2012; see also: Huber 2017; Sigurjónsson 2015
[36] See for instance: DiEM25 2017; RSA 2015; Peston 2017.
[37] For further elaboration see Jackson 2017.
- An earlier draft of this paper was prepared as input for the UK Global Strategic Trends review, published by the UK Ministry of Defence.
- The full paper is available for download in pdf (2MB) | Jackson, T 2018: The Post-Growth Challenge: Secular Stagnation, Inequality and the Limits to Growth. CUSP Working Paper No 12. Guildford: University of Surrey.
- Read more about how we are rethinking economics.


