Beyond Redistribution—Confronting inequality in an era of low growth
This article explores inequality in the UK. It examines the evidence for rising inequality over the last fifty years, estimates the economic welfare lost to society from an unequal distribution of incomes and addresses the critical question of managing inequality in the context of declining growth rates. It finds no evidence to support the claim that inequality inevitably rises as GDP growth declines. On the contrary, empirical data show that lower growth rates are as likely to be associated with declining inequality in recent UK history. This blog first appeared as a policy briefing for the UK All-Party Parliamentary group on Limits to Growth, Oct 2018.
Inequality matters
In March 1968, shortly before his assassination, Senator Robert F Kennedy gave a speech at the University of Kansas in which he noted some of the shortcomings of the Gross Domestic Product (GDP) as a measure of the nation’s welfare: its indiscriminate inclusion of destructive activities; its exclusion of any account of environmental damage; its failure to value the work that people do for free. Ultimately, Kennedy argued, the GDP measures ‘neither our wit, nor our courage, neither our wisdom nor our learning, neither our compassion nor our devotion to our country. It measures everything in short except that which makes life worthwhile.’[i]
One of the key omissions in the GDP is the impact of income inequality. In measuring aggregate income, the conventional measure fails to account for what happens when income is shared unequally by people across society. Economic injustice was one of the principal themes in Kennedy’s speech: he lamented an America he saw, even at that time, as unnecessarily divided between the ‘haves’ and the ‘have nots’. Half a century later, the situation is even worse. Rising inequality has led to social unrest and political instability. This year, two US Senators introduced the Measuring Real Income Growth Act of 2018, which would require the Bureau of Economic Analysis (BEA) to report how economic growth is distributed across the income spectrum.[ii]
Addressing inequality is finally achieving the attention it deserves.[iii] But this challenge is particularly acute in the context of declining growth rates[iv]—as the French economist Thomas Piketty has pointed out.[v] There is an immediate sense in which the distribution of incomes becomes more critical when economic expansion is, for whatever reason, hard to come by. As long as the size of the pie keeps growing, it is possible for the poor to get richer without the rich having to get poorer. When the pie stops growing, then reducing poverty relies on the re-distribution or perhaps the ‘pre-distribution’ of incomes.[vi]
The aim of this briefing note is to explore that challenge. First, we examine the evidence for inequality in the UK. Next, we present an analysis which estimates the economic welfare lost to society as a result of having an unequal distribution of incomes and discuss the implications of this for measuring social progress.
We then return to the particular challenge raised by Piketty—namely the relationship between declining growth and inequality—before concluding with a short discussion on the prospects for tackling inequality in the future.
Measuring inequality in the UK
It is now generally acknowledged that income inequality in the UK has risen substantially since the 1970s. The Gini coefficient measures the distribution of incomes on a scale from 0 (where everyone has exactly the same income) to 1 (where one person receives all the income). Applied to household incomes after tax and benefits but before housing costs (BHC), the UK Gini coefficient rose by 50% from 0.24 in 1977 to 0.36 in 2009.
When measured after housing costs (AHC), the Gini coefficient rose by over 60%, from 0.25 to 0.41 during the same period. Figure 1 (overleaf) also shows the share of the nation’s income going to the top 1% of households. This share rose almost three-fold from 3% in 1976 to just under 9% in 2009. All three measures have fallen slightly since the financial crisis, but remain substantially higher than they were half a century ago. When Robert Kennedy gave his University of Kansas speech in 1968, income inequality was declining. Since that time it has risen considerably.
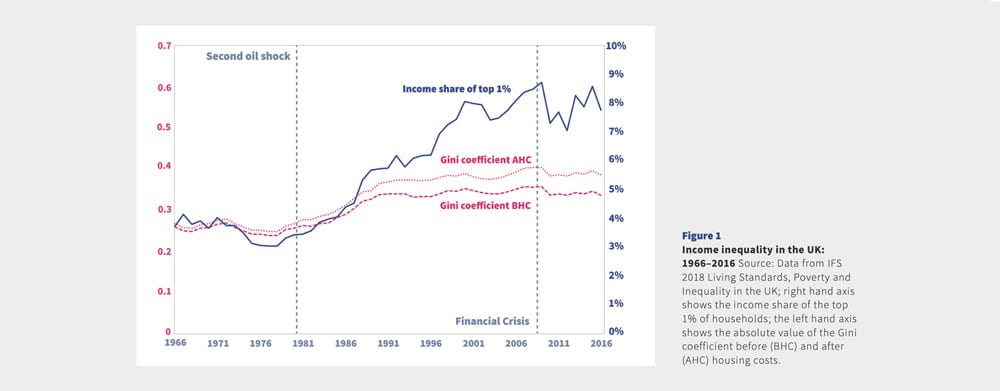
One of the determinants of future trends in income inequality is the level of wealth inequality in the country. Those who own more property and hold higher levels of financial assets tend to have higher incomes and more bargaining power in society. In fact, wealth inequality in the UK is considerably higher than income inequality: the wealth Gini coefficient is 0.62 as opposed to 0.34 for income inequality.
Certain components of wealth inequality have been increasing sharply since the financial crisis. The Gini coefficient of property wealth rose from 0.62 to 0.67 in a decade. The Gini coefficient of financial wealth has risen from 0.81 to 0.91 in the same space of time. Just 10% of households now own more than 60% of financial wealth in the UK, while the poorest 10% of households labour under rising financial debt. These numbers tell the story of an increasing concentration of wealth in the hands of a minority of the population and suggest the potential for further rises in income inequality over the coming years.[vii]
The welfare lost through inequality
The costs of inequality are borne not just by the poor but by society as a whole. More unequal societies tend to have lower life expectancy, higher infant mortality, more crime, a higher incidence of mental illness, greater levels of obesity, less trust and lower educational achievements.[viii] People in the richest areas have 20 more years of healthy life than those in the most deprived areas.[ix] Very high levels of inequality generate both social and political instability. It is not particularly easy to get a clear handle on the precise value of these welfare costs to society. But it is clear that they matter.
An interesting attempt to capture the welfare lost to society through inequality was proposed by the (late) British economist Anthony Atkinson.[x] The Atkinson Index measures this welfare loss as a percentage of the overall national income. Figure 2 shows the results of a calculation of the Atkinson Index for the UK. The broken line shows the value of the Atkinson Index as a percentage of the GDP. The solid line shows the absolute value of the welfare loss.
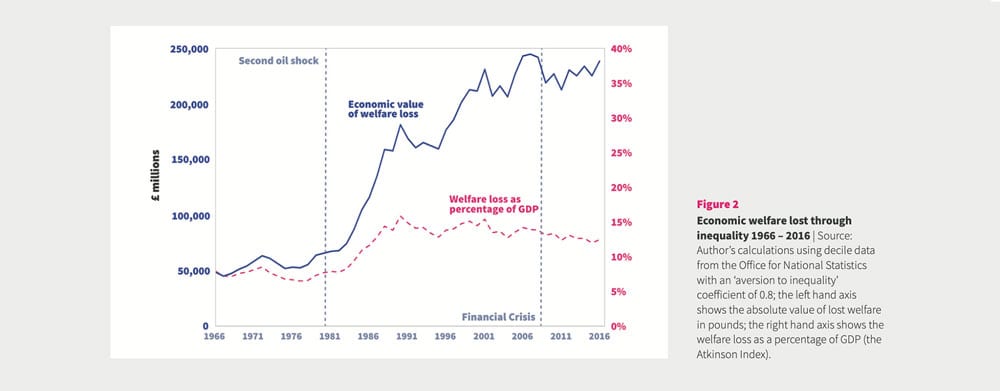
The pattern of the Atkinson Index is not dissimilar to the patterns in Figure 1. As a percentage of GDP, the welfare lost through inequality rose from 6.5% of the GDP in 1977 to a peak of around 15% during the 1990s and 2000s, before stabilising at around 12.5% of GDP today. Notably, however, the absolute value of the welfare rose almost five-fold over the last five decades from around £50 billion (in today’s money) in 1950 to a little under £240 billion in 2016. To put the scale of these losses in perspective, the value of the welfare lost as a result of income inequality today is around twice the annual budget of the NHS in 2016/17.[xi]
One further aspect of inequality is worth mentioning briefly. Because carbon emissions are linked closely to income, richer households tend to have higher emissions per capita than poorer ones. In fact, a recent study found that the richest 10% of the population emit on average 2.4 times the carbon associated with the poorest 10%. Within those broad groups, lie even starker inequalities. Some richer households in the sample emitted 30 times more carbon than the poorest households.[xii] In a world where carbon emissions impose potentially huge social costs on society, carbon inequality represents a form of social transfer from the poor to the rich.
Does slow growth lead to rising inequality?
What’s interesting about Atkinson’s analysis is the suggestion that society may be willing to accept a lower level of aggregate income if this income were more equally distributed. In other words, the dilemma of declining growth might not be so intractable as is commonly supposed, if incomes were less unequal. But this is precisely where Piketty’s challenge becomes important. If his contention is right that declining growth rates lead to rising inequality, then achieving this more equal society would become harder rather than easier as growth slows down. We can test this hypothesis— both empirically and conceptually. For example, we could look into the relationship between the Gini coefficient or the Atkinson Index and GDP growth over the last half a century or so to see if there is indeed a pattern which supports Piketty’s claim.
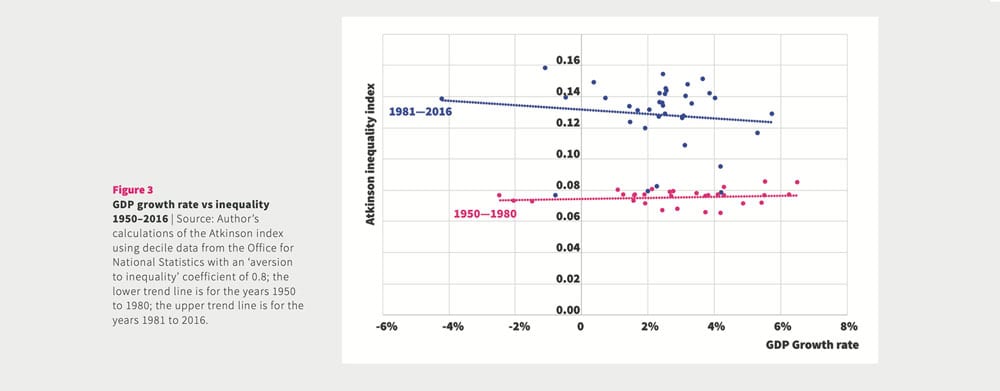
Figure 3 shows the values for the Atkinson Index plotted against the annual growth rates in GDP over the period between 1950 and 2016. If Piketty’s thesis were correct, we would expect to see a clear downward sloping trend, with the points clustered around a line sloping from the top left of the graph to the bottom right. Lower growth rates should clearly exhibit higher levels of inequality. But looked at over the period as a whole, there is very little in the way of a discernible pattern, with the points scattered fairly unevenly across the graph.
When the data are split into two periods from 1950 to 1980 and from 1981 to 2016, however, some interesting phenomena emerge. First of all, the trend line between 1981 and 2016 is higher than the trend line from 1950 to 1980; the substantial rise in inequality during the 1980s is responsible for this difference. More to the point, the trend line for the later years does have a very slight downward slope. During the last few decades, Piketty’s hypothesis appears to hold: lower growth rates were associated with higher levels of inequality. The tendency is not particularly strong (the slope is very shallow) and indeed the statistical significance of this downward trend is very low. The trend line for the earlier (pre-1980) period has a better fit. But surprisingly the trend points very slightly upwards—directly counter to expectations. Between 1950 and 1980 slower growth rates were associated with lower inequality.[xiii] Clearly, Piketty’s hypothesis cannot be universally true and the question arises: what are the precise conditions under which slow growth leads to rising inequality and when might the opposite happen. Put another way, how might we tackle inequality in the face of a declining growth rate?
The conditions of inequality
Piketty’s argument was a theoretical one. He showed, algebraically, that the share of income going to the owners of capital assets was proportional to the rate of return on capital multiplied by the savings rate and divided by the growth rate. Intuitively, dividing by a number that is getting very small suggests that the share of income to capital must rise. If capital (wealth) were equally distributed amongst the population this would not matter so much. But we have seen already that this is distinctly not the case in the UK (or in the US). Under these conditions, a greater share of income going to the owners of capital means rising inequality.
Piketty’s analysis depends, however, on a couple of critical assumptions.[xiv] The first of these concerns the behaviour of the savings rate as the growth rate declines. Piketty implicitly assumed it would stay constant. The second relates to the ease with which it is possible to substitute capital for labour. With constant savings rate and high substitutability of capital for labour, it’s possible to show that Piketty was right. Inequality rises—potentially explosively—as shown in the uppermost solid line in Figure 4.
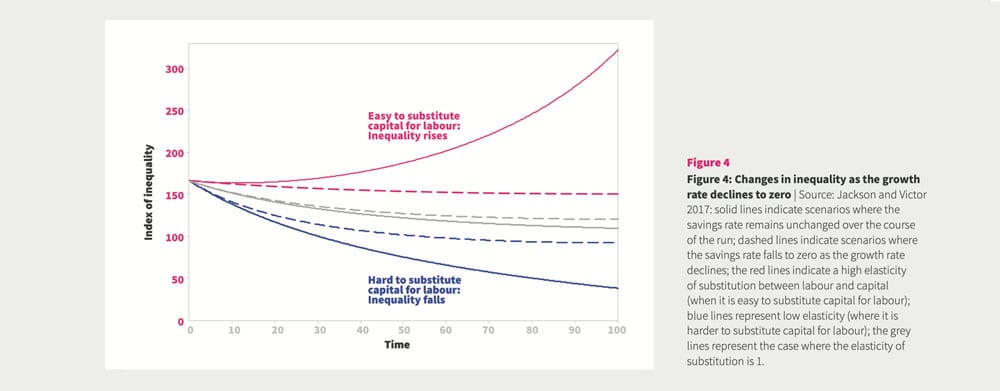
But outside those conditions, different outcomes are entirely possible. One such outcome is a future where the net savings rate declines alongside the growth rate. This is likely to happen automatically, for instance, when the rate of return on investment falls. This would tend to disincentivise saving and reduce the overall savings rate. Under these conditions (illustrated by the broken lines in Figure 4), inequality is immediately contained within more reasonable bounds. An even more striking impact is achieved by reducing the ease with which capital replaces labour. Under conditions where it is harder to substitute capital for labour (shown by the two blue lines in Figure 4), inequality declines substantially, even as the growth rate falls to zero.
In short, the idea that rising income inequality is an inevitable consequence of falling growth rates is incorrect. Under the appropriate conditions, an economy with a declining growth rate might just as equally be headed towards falling inequality as to rising inequality.
Confronting inequality in an era of low growth
These arguments might seem purely theoretical. But they bear an important relationship to the real world. In a situation where government policy, the behaviour of firms and the conditions of the market all conspire to protect the rate of return on capital at the expense of the wages of ordinary workers, investment might flourish and the substitution of capital for labour is likely to be high. But these are exactly the conditions that would lead to an explosive rise in inequality like the one shown in the upper line in Figure 4.
This world has a strong resemblance to some dystopian visions of the future associated with increasing automation: a small minority of ever more powerful high-tech companies drive an increasingly digitalised world with a rising capital intensity in which there is less and less need for wage labour. Overall demand may well stagnate, but as long as the minority owners of capital have sufficient sway over government to protect the returns to capital, the conditions described above prevail. The result may well be the complete ‘immiseration’ of wage labour.[xv] Crucially, redistributional fiscal measures—income taxes, wealth taxes, welfare subsidies (even the much vaunted idea of a basic income)—would, on their own, do little to halt this social disaster.[xvi]
Under another set of conditions, things could be radically different. It is entirely possible to envisage a world where there is far less substitutability between labour and capital, the returns to capital are stabilised by a decline in the savings rate and the rights of workers are better protected. In terms of policy, this might involve more distributed ownership of firms, increased worker representation on boards, better distribution of the rewards from innovation, and the adoption of a ‘right to work’, with government playing the role of ‘employer of last resort’. It is beyond the scope of this paper to explore these innovations in depth, but they will be revisited in subsequent papers in this series.
Inequality matters. This is the principal lesson from the history of recent decades. It matters to societal wellbeing. It matters in terms of our ability to address the critical challenges of today such as climate breakdown or the rapidly changing demands on our health system. It matters for financial, social and even political stability. Robert Kennedy’s call for a fairer society and a more meaningful vision of progress is as relevant today as it was fifty years ago.
This article first appeared as a policy briefing for the UK All-Party Parliamentary group on Limits to Growth, and is available for download in pdf.
Notes
[i] Jackson, T 2018: Everything, in short, except that which makes life worthwhile. Centre for the Understanding of Sustainable Prosperity, Blog, 18 March 2018. Online: cusp.ac.uk/rfk50
[ii] See: democrats.senate.gov/newsroom/press-releases/schumer-heinrich-introduce-legislation-to-require-new-income-growth-data-alongside-quarterly-gdp-reports
[iii] The first briefing paper in this series explored the evidence for this so-called ‘secular stagnation’ and discussed some of its major implications. See Jackson T 2018. Understanding the New Normal—The Challenge of Secular Stagnation. AETW Briefing Paper No 1. APPG on Limits to Growth. Online: limits2growth.org.uk/publications
[iv] Piketty, T 2014. Capitalism in the 21st Century. Harvard: Harvard University Press.
[v] The term pre-distribution has been used to describe policies that attempt to equalise gross incomes (and wealth) rather than tax it (and subsidise the poorest) after the fact.
[vi] See for instance: IPPR 2018. Prosperity and Justice—a plan for the new economy. Online at: https://www.ippr.org/research/publications/prosperity-and-justice.
[vii] See Table 2.5 in ONS 2018 Wealth in Great Britain, Wave 5. London: Office for National Statistics. See also: ippr.org/publications/wealth-in-the-twenty-first-century. Data available online at: ons.gov.uk/peoplepopulationandcommunity/
personalandhouseholdfinances/incomeandwealth/datasets/totalwealthwealthingreatbritain
[viii] Wilkinson, R and K Pickett 2009. The Spirit Level. London: Penguin.
[ix] publichealthmatters.blog.gov.uk/2017/07/13/understanding-health-inequalities-in-england
[x] Atkinson, A 1970. On the measurement of inequality. Journal of Economic Theory, 2 (3): 244–263. For more detail see Stymne and Jackson 2000. Intra-generational equity and sustainable welfare. Ecological Economics, 33: 219–236. Figure 2 updates the UK index estimated in that paper. The use of decile data may underestimate the impact of inequality within the deciles, particularly in the richest decile.
[xi] Planned spending for the Department of Health was approximately £120.5 billion in 2017/18. This comparison is illustrative and should be treated with some caution. It doesn’t necessarily imply that this money is somehow available to triple the NHS budget!
[xii] Gough, I et al 2012. The distribution of total greenhouse gas emissions by households in the UK, and some implications for social policy. London: Centre for the Analysis of Social Exclusion (CASE). Online: sticerd.lse.ac.uk/dps/case/cp/CASEpaper152.pdf
[xiii] The R2 value for the later trend line is less than 0.02; for the earlier years the trend line is around 0.04 which is also very low.
[xiv] The arguments summarised here are set out in more detail in Jackson, T and P Victor 2016. Does slow growth lead to rising inequality? Ecological Economics 121: 206–219 and in Jackson, T and P Victor 2017. Confronting inequality in a post-growth world. CUSP Working Paper No 11. Online: cusp.ac.uk/themes/aetw/wp11.
[xv] See Susskind, D 2017. A model of technological unemployment. economics.ox.ac.uk/materials/ papers/15126/819-susskind-a-model-of-technological-unemployment-july-2017.pdf.
[xvi] See Jackson and Victor 2017 (Note 14) for further discussion of the impacts of different redistribution policies.


